
Scarcity or Abundance? Place Your Bets
Fantasies of doom and measures of abundance

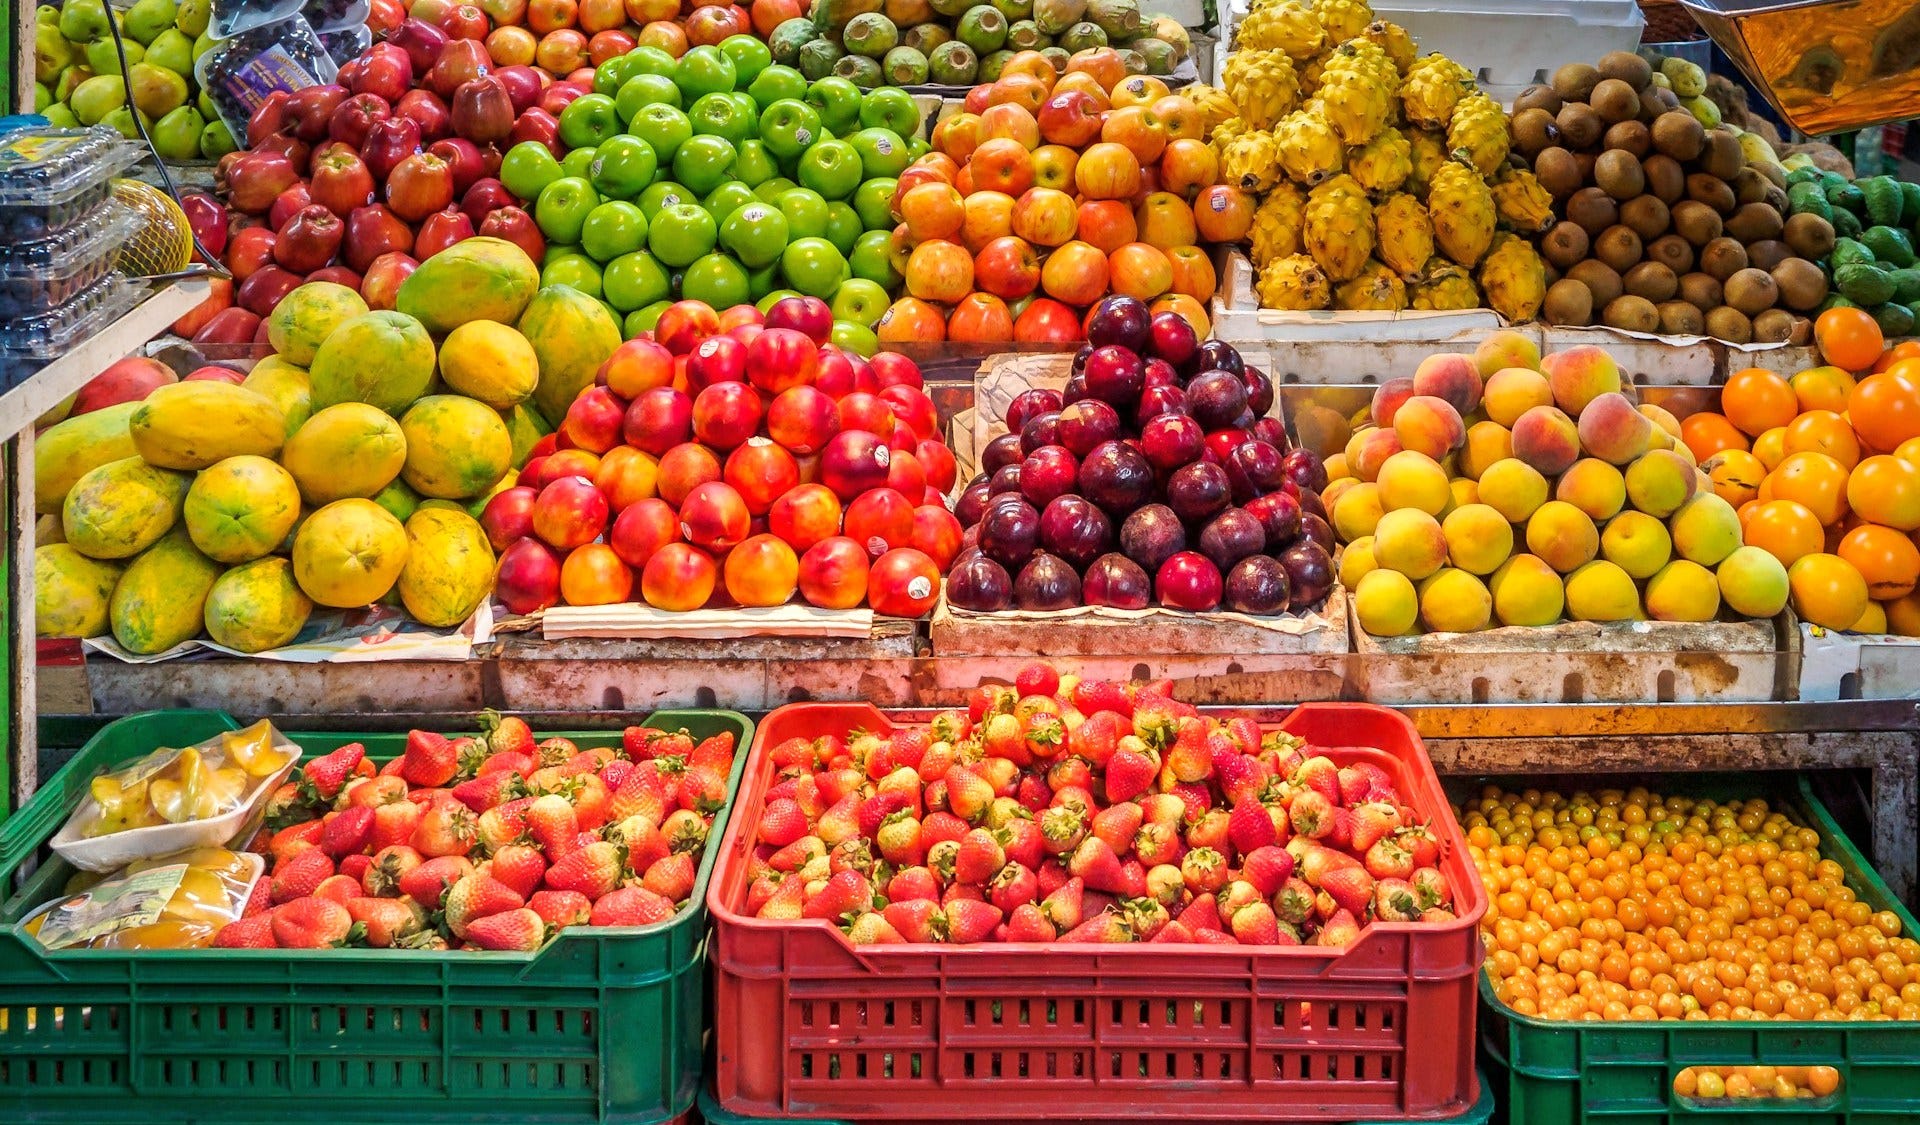
Photo by Alexander Schimmeck on Unsplash
In a recent blog essay, I looked at the beliefs of people around the world about progress. Despite clear data showing improvements in all the trends about which people were surveyed, in every country unwarranted pessimism was rife. I looked at some causes of falsely pessimistic beliefs.
Summary:
In this article, I am going to look at past predictions and forecasts that turned out to be excessively pessimistic. I will especially pick on butterfly ecologist Paul Ehrlich since he has been so influential, so wrong, and so persistent in his errors. We will look at a famous bet between Ehrlich and economist Julian Simon and extract some lessons from it. Finally, I will examine the Simon Abundance Index – an excellent measure of the improving state of the world.
Faulty Forecasts
Pessimism has been with us for a long, long time. Some of it is understandable given the context of the time. In the early Industrial Revolution, England was rapidly burning its way through forests for fuel. It must have seemed inevitable that wood supplies would be exhausted. An apparently safe prediction would be to foresee the end of the iron industry as England was mostly stripped of forestland in the first half of the eighteenth century. Wood for charcoal fuel was running up against the need for wood for shipbuilding. But along came coal. And the steam engine. And so on.
Pessimism can easily co-exist with recent major progress. Consider Northern Europe and North America in 1830. Enjoying the longest period of peace in a generation, they benefited from a flow of inventions, discoveries, and technologies. Matt Ridley notes that the term “technology” was coined in that year.[1] He points out some of those innovations: steamboats, cotton looms, suspension bridges, Portland cement, the Erie Canal, the electric motor, the first photograph, Fourier analysis. Surely, a time for optimism!
And yet, around 1830, opponents of the Liverpool to Manchester railway “forecast that passing trains would cause horses to abort their foals. Others mocked its pretensions to speed: ‘What can be more palpably absurd and ridiculous than the prospect held out of locomotives travelling as fast as stagecoaches!’ cried the Quarterly Review. ‘We trust that Parliament will, in all railways it may sanction, limit the speed to eight or nine miles an hour.’“
Remarkable progress was experienced from 1875 to 1925 in Europe including an unprecedented rise in living standards. This time saw the spread of electricity, cars, typewriters, universities, movies, vaccines, and indoor plumbing. Despite this, many intellectuals obsessively worried themselves and others with thoughts of imminent decline, degeneration, and disaster.
The Great Horse Manure Crisis of 1894
A 128-year-old example may seem amusing today, but it was taken extremely seriously in the day. It is also notable because the logic behind the fear is the same as that behind many more recent supposed crises.
Around the time that the nineteenth century turned into the twentieth, the streets of London were trafficked by over 11,000 hansom cabs, plus several thousand horse-drawn buses, each using 12 horses per day. Altogether, the city was traversed by over 50,000 horses daily. That does not even count the other horse-drawn conveyances delivering goods. An average horse would produce 15 to 35 pounds of manure daily along with 2 pints of urine. (New York could boast of 100,000 horses and about 2.5 million pounds of manure a day.)

The manure drew in vast numbers of flies which spread typhoid fever and other pathogens. As if massive quantities of poop and pee were not enough, working horses live only about three years. Dead horses were hard to move so it was common to let them rot until they could more easily be sawn into handy-size pieces to carry away. In 1894, The Times newspaper predicted: “In 50 years, every street in London will be buried under nine feet of manure.” This became known as the ‘Great Horse Manure Crisis of 1894’. Now, I have not checked the volume calculations, but have no reason to doubt that projection given its simplistic straight-line projection.
As we all know, “peak poop” was soon reached, and nobody was buried in it over their head.
The situation seemed so dire that it was debated at the world’s first international urban planning conference in New York. No solution was offered. Urban life was surely doomed. As we all know, “peak poop” was soon reached, and nobody was buried in it over their head. Henry Ford figured out how to build cars (automobiles) affordably and electric trams and motors buses replaced horse-drawn buses. Worldwide, horses ceased to be enslaved to our transport needs and motorized engines took over with far less noisome emissions. Unlike horses, motor vehicles have become vastly less polluting over the subsequent years.
Keep shoveling the manure
More recently, we have seen plenty of remarkably intelligent people make predictions that turned out to be hilariously (or soberingly) off the mark. In 1950, Albert Einstein warned that “only the creation of a world government can prevent the impending self-destruction of mankind.”
English novelist and chemist, C.P. Snow, wrote in 1961 that “within, at most, 10 years, some of those [nuclear] bombs are going off. I am saying this as responsibly as I can. That is the certainty.”
Joseph Weizenbaum, an MIT computer scientist, stated in 1976 that “I am completely certain … that by the year 2000, you [students] will all be dead.”
Hans Morgenthau, an influential international relations theorist, declared in 1979 that “the world is moving ineluctably towards a third world war—a strategic nuclear war. I do not believe that anything can be done to prevent it.” I have to admit that in 1979 I feared the same thing. However, I was only 15 at the time and the Cold War was warm.
According to the Bulletin of Atomic Scientists and their Doomsday Clock, humanity has been at a few minutes to midnight for 75 years! We have been this close to extinction every year, year after year after year. When I checked the clock in 2021, I found that the clock had been set at 100 seconds to midnight – the closest ever. It will all be over, any time now. I should note that the editor at the Bulletin does acknowledge that there is basically no method behind this alarmist madness. It began as a reflection of one person’s subjective feeling and remained that way.
Eco-pessimist Lester Brown has a consistently poor record. In 1974 he predicted that a turning point had been reached and “farmers can no longer keep up with demand”. They did. In 1981, he said “global food insecurity is increasing”, but it was not. 1984: “the slim margin between food production and population growth continues to narrow”. Still wrong. 1989: “Population growth is exceeding farmers’ ability to keep up.” Nope. 1994: He declared that a turning point had been reached and food production per person would plummet. Right after that assertion, the price of wheat fell to record lows, and stayed there for a decade. [Ridley, 2010, p.300]
In their 1967 book, Famine, 1975!, William and Paul Paddock claimed that mass starvation was inevitable and we should leave hopeless cases such as India and Egypt to starve. When those countries instead improved, they argued in 1975 for a ban on research into increasing food production in high population growth countries. Apparently, they badly wanted their prediction to come true and would help it along if they could.
As the chart below shows, food production in India, as well as China and the world, has continued to increase. Checking the food news in India, I find this: “India is expected to produce a record 305.4 million tonnes of grain in 2020-21, an increase of 8 million tonnes from last year’s record harvest, according to a report from the Foreign Agricultural Service of the US Department of Agriculture (USDA)… Government wheat stocks have ballooned on back-to-back record harvest, the USDA said. Stocks are estimated at 60.3 million tonnes as of June 1.” [Reidy, 2021; 117-118]
At the time of the first Earth Day in 1970, ecologist Kenneth Watt declared, “By the year 2000, if present trends continue, we will be using up crude oil at such a rate… that there won’t be any more crude oil. You’ll drive up to the pump and say, `Fill ‘er up, buddy,’ and he’ll say, ‘I am very sorry, there isn’t any.’”
Watt echoed other voices going back decades. In 1919, the U.S. Geological Survey warned that world oil production would peak in 1928. In 2005, Princeton University geologist Ken Deffeyes predicted peak global oil in 2005. Instead, global production has risen steadily from about 32 million barrels per day in 1965 to 95 million in 2018. In 1980, global proven reserves were estimated at 684 billion barrels – about 30 years supply at that year’s rate of extraction. We have since extracted 983 billion barrels, but proven reserves have nearly tripled to 1.7 trillion barrels – enough for 50 years at the current rate. [Bailey, 2020]
What is wrong with excessive pessimism?
Of course, there are bad optimistic forecasts. But these seem to be vastly outnumbered by bad pessimistic forecasts. Most of them seem to be apocryphal and taken from science fiction. While optimistic forecasts usually do not cause much trouble (except for overly bold companies and their own money), overly pessimistic forecasts can spur desperate actions with numerous unintended consequences. If one worrying trend is exaggerated it will distract attention and resources from more urgent and important trends. Also, getting things repeatedly wrong undermines the credibility of institutions and experts.
When the bad things in the world are overdramatized, people fall into a constant, heightened sense of crisis and stress. Those who declare tipping points and demand action “now or never” elicit feelings that lead to stress or apathy. The call to urgent action leads you to think less critically. This in turn means supporting costly and counterproductive policies. For instance they may—as some writers have urged—deny help to the poor due to fear of overpopulation. They may block nuclear power and GMOs even though they can help with climate and hunger and the environment.
When overly dramatic and implausible scenarios are baked into models, those models become used by business and government to make decisions. This leads to actions being proposed which are costly, ineffective, and drain our ability to tackle more realistic problems.
We should remember something emphasized both by Julian Simon and Hans Rosling: Things can be bad and getting better. By failing to look at the long-term trends showing improvements, we over-focus on what’s bad and distressing, imagine it is worse than it is, and assume that it is getting worse still.
Let us look at a famous bet, this being between an optimist and a pessimist, the former with a good understanding of the economy and the latter… not. (If you are already familiar with the bet, you may still find something new in this section.)
The Simon-Ehrlich Bet Re-Examined
Any useful thinking about the trajectory of human wellbeing will have to consider the availability of resources. Dystopian visions of the future typically involve a world of starvation, poverty, and energy shortage. More hopeful visions see a world in which there are plentiful resources to provide for the needs and wants of everyone. When considering the future, the former, catastrophic view has been promulgated over many years by Stanford biologist Paul Ehrlich, his most famous book being The Population Bomb. The hopeful view has been given foundation by economist Julian L. Simon, author of the classic The Ultimate Resource.
Short-term price spikes would spur four responses among people: they would consume less, search for new supplies, invent and discover substitutes, and recycle.
Simon and Ehrlich disagreed over the nature of the relationship between abundance of resources and population growth. As a neo-Malthusian, Ehrlich argued that population growth would lead to scarcer resources and far higher prices. Simon argued that the opposite was true: As population increased, the price of resources would decline in the long run. Short-term price spikes would spur four responses among people: they would consume less, search for new supplies, invent and discover substitutes, and recycle. These four actions would result in long-run prices that were even lower than before the spike.
Ehrlich had published a claim that “If I were a gambler, I would take even money that England will not exist in the year 2000”. When this scenario did not occur, he responded that “When you predict the future, you get things wrong. How wrong is another question. I would have lost if I had taken the bet. However, if you look closely at England, what can I tell you? They're having all kinds of problems, just like everybody else.” Reality has continued to bounce off Ehrlich without making any impression.
Frustrated with a debate that did not lead anywhere, Simon challenged Ehrlich to a more realistic wager. He offered “to stake US$10,000 ... on my belief that the cost of non-government-controlled raw materials (including grain and oil) will not rise in the long run”. Simon challenged Ehrlich to choose any raw material he wanted and a date more than a year in the future. If the inflation-adjusted price fell over that period, Simon would win; if they rose, Ehrlich would win. Ehrlich picked copper, chromium, nickel, tin, and tungsten. The bet was agreed on September 29, 1980, with September 29, 1990, as the payoff date.
Between 1980 and 1990, global population grew by more than 800 million – the greatest one-decade increase of all time. This looked like the ideal conditions for an Ehrlich win. But by September 1990, each of the selected metals had fallen in price. Adjusted for inflation, the real price of the basket of metals had fallen by 36%. In October 1990, Paul Ehrlich mailed Julian Simon a check for $576.07, acknowledging Simon’s winning of the wager.
Matter settled? Hardly! Losing a clear bet stings. It was not surprising that advocates of neo-Malthusianism wanted to dismiss the outcome. Alas, they had something to go on since Simon agreed to a bet that was improperly advantageous to the Ehrlich side, even though they did lose in this case. Some researchers examined historical prices of those five metals and came to a different conclusion.[1] Kiel et.al. looked at prices in 98 ten-year intervals between 1900 and 2007 – during which time world population quadrupled. They found that Ehrlich would have won the bet 61.2% of the time with an average return of 10.5%.
So, matter settled now? No!
Commodity prices over a decade are a poor measure of long-term scarcity or abundance. The prices vary greatly with economic cycles. Simon made a mistake in using real prices (prices adjusted for inflation). In his book, The Ultimate Resource 2, Simon points out several alternative measures of the cost of a commodity. You can look at the nominal price or the real price. You can look at the price compared to average wages. Or you can compare it to household income. Even inflation-adjusted real prices are not the best measure because you are looking at the cost of a commodity relative to the cost of money. If real earnings have gone up more than the cost of money, the commodity is more affordable. In discussing copper, he wrote:
“The most important measure is the price of copper relative to wages. This price has declined very sharply.” “Every measure leads us to the same conclusion, but these calculations of expenditures for raw materials as a proportion of total family budgets make the point most strongly.” [Simon 1998, 31,33]
Pooley & Tupy reviewed data from 1900-2019. Understanding that what matters is the real price of resources compared to real earnings, they used time prices – how many hours of work it takes to pay for a fixed amount of a resource.[2] They found that Simon wins the bet 54.2% of the time with an average return over this 110-year period of 2.22%. Given the war clause in the original bet, the researchers ran the numbers excluding the years for World War I, World War II, the Korean War, the Vietnam War, and the War on Terror. Simon would win the resulting 73 ten-year bets 69.9% of the time with a return of 18.0%.
During that 119-year period, the time price of the five-metal basket of commodities fell by 87.2% despite a huge growth in both US (330%) and global population (375%).
During that 119-year period, the time price of the five-metal basket of commodities fell by 87.2% despite a huge growth in both US (330%) and global population (375%). Put another way: “The time required for a blue-collar U.S. worker to earn enough money to buy one basket in 1900 would get him or her 7.84 baskets in 2019.” Although nominal prices of the basket increased by 2,909%, over the same period blue-collar hourly income increased by 23,485%.
Simon and others have found the same result for numerous other resources. On p.167 of The Ultimate Resource 2, Simon shows the falling cost of oil, coal, and electricity relative to CPI and to US wages.
While Ehrlich took a static view of resources, Simon understood that resources do not really exist until people find them and put them to use. What happens when the price of a resource rises? Human ingenuity and intelligence driven by the market incentive to control costs lead to a search for new supplies and spur innovations that allow us to substitute or do more with less. In Simon’s view, this will lead to prices lower (in real terms) than in the past.
I do not think that has to be true in every case. With real prices, the cost of resources is just measured against the value of money. But what matters to us is whether we have to give up more, the same, or less of other goods. Measuring cost by earnings makes sense. Real prices can be a quick guide to whether something is truly getting cheaper or not – especially when prices are low and stable – but it is affordability that matters.
Ehrlich’s Failed forecasts
Failed forecasts and predictions from doomsayers are abundant. They are a resource that seems truly endless. Ehrlich has been a remarkably rich source of forecast failure. Here are a few founded on his assumptions of fixed limits and scarcity:
“What will we do when the [gasoline] pumps run dry?” After that question, gasoline became cheaper than it had in decades.
Ehrlich on DDT: “The US life expectancy will drop to forty-two years by 1980, due to cancer epidemics.” But both cancer incidence and the death rate from cancer fell steadily, falling 16% between 1950 and 1997, accelerating after that. US life expectancy at birth went up from 70.5 in 1967 to 74.4 in 1980 to 79.1 recently.
1975: “In the 1970s and 1980s, hundreds of millions of people will starve to death in spite of any crash programs embarked upon now. At this late date nothing can prevent a substantial increase in the world death rate.” In 1968, in 34 out of 152 countries the food supply was under 2,000 calories per person. In 2017, that was the case in only 2 of 173 countries.
“India couldn't possibly feed two hundred million more people by 1980.” [The Population Bomb] By 1974, India was a net exporter of wheat.

Figure 1: Daily per capita supply of calories, 1934 to 2013
“Most of the people who are going to die in the greatest cataclysm in the history of man have already been born. By…[1975] some experts feel that food shortages will have escalated the present level of world hunger and starvation into famines of unbelievable proportions. Other experts, more optimistic, think the ultimate food-population collision will not occur until the decade of the 1980s.” [“Eco-Catastrophe!” 1969] In reality, between 1950 and 2000, barley, corn, cotton, oats, and wheat became three times cheaper when compared to wages. World food prices fell by half from 1960 to 1995.[1]
“Dr. Ehrlich predicted… that the oceans could be as dead as Lake Erie by 1979. Today Lake Erie is palatable, and Dr. Ehrlich is not.” (P.J. O’Rourke, Parliament of Whores)
“Most of the people who are going to die in the greatest cataclysm in the history of man have already been born,” [From a 1969 magazine article.] “Sometime in the next 15 years, the end will come. And by ‘the end’ I mean an utter breakdown of the capacity of the planet to support humanity.” [Ehrlich on CBS News in 1970]
“Population will inevitably and completely outstrip whatever small increases in food supplies we make. The death rate will increase until at least 100-200 million people per year will be starving to death during the next ten years.” [Mademoiselle, April 1970] A claim made in 1970, just before an agricultural revolution that rapidly increased the world’s food supply.
Famine since 1970 has been unrelated to food supply. Famine resulted from wars and political problems, including the Cambodia starvation of 1970, African famines in the 1980s and the DR of Congo in the 1990s, Ethiopia in numerous decades, and so on. Fewer people die in famines over time.

Figure 2. Famine victims by continent since the 1860s [OWID2]
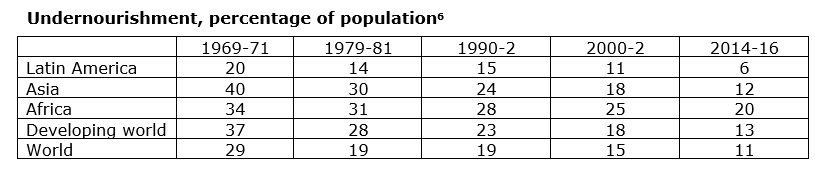
Famines aside, fewer and fewer people are undernourished. Certainly, there is plenty of room to improve availability and affordability of nutritious foods (and not just calories). Again, things can be bad but getting better. According to the FAO, the percentage of the global population who are undernourished has fallen from just over 50% in 1945 to 20% in 1985 to about 11% in 2015. Here are daily calories per capita over the last several decades:
China: 1934: 2230. 1961: 1439. 1990: 2515. 2013: 3108.
India: 1950: 1570. 1970: 2111. 2013: 2559.
World: 1961: 2196. 1990: 2621. 2013: 2884.[1]
Undernourishment, percentage of population[2]
Ehrlich told readers of the 1970 Earth Day issue of The Progressive that between 1980 and 1989, some 4 billion people, including 65 million Americans, would perish in the “Great Die-Off.” At that time, he also warned that “[i]n ten years all important animal life in the sea will be extinct. Large areas of coastline will have to be evacuated because of the stench of dead fish.”
In a 1971 speech at the British Institute For Biology, he predicted that: “By the year 2000 the United Kingdom will be simply a small group of impoverished islands, inhabited by some 70 million hungry people. If I were a gambler, I would take even money that England will not exist in the year 2000.” New Scientist magazine approvingly drew attention to his speech in an editorial titled “In Praise of Prophets.”
Ehrlich provides an exceptional example of how not to behave when thinking and communicating about possible futures. He often attributes some combination of stupidity and scientific ignorance to those with whom he disagrees. Alluding to Simon’s book, The Ultimate Resource, saying ‘The ultimate resource – the one thing we’ll never run out of is imbeciles.” He often uses words like “ignorant,” “crazy,” “imbecile,” and “moronic”.
Ehrlich has been evasive in acknowledging errors he made, while being intellectually dishonest in taking credit for things he claims he got “right”. Despite being demonstrably and repeatedly wrong, somehow people continue to quote him approvingly and his books sell in large numbers. When confronted with his failure to revise his predictions, in 2009 Ehrlich actually responded: “perhaps the most serious flaw in The Bomb was that it was much too optimistic about the future.” Even someone as green-friendly as Bill Gates recognizes the errancy of Ehrlich’s judgment. [Gates, 2013]
The Simon Abundance Index
Inspired by Julian Simon’s work, The Simon Project has developed a thorough and highly informative framework for measuring progress. Is progress too subjective or culturally relative to measure? Steven Pinker argues that it’s not:
Most people agree that life is better than death. Health is better than sickness. Sustenance is better than hunger. Wealth is better than poverty. Peace is better than war. Safety is better than danger. Freedom is better than tyranny. Equal rights are better than bigotry and discrimination. Literacy is better than illiteracy. Knowledge is better than ignorance. Intelligence is better than dull wittedness. Happiness is better than misery. Opportunities to enjoy family, friends, culture, and nature are better than drudgery and monotony. All these things can be measured. If they have increased over time, that is progress. [Pinker, 2018]
The Simon Project looks deeper into the relationship between population growth and resource availability using the new concept of the Simon Abundance Framework. This framework deploys three core concepts: Time Price, Price Elasticity of Population, and the Simon Abundance Index.

Figure 3: The Simon Abundance Framework
Time price: As we have seen, the time price denotes the amount of time that an average person has to work in order to earn enough money to buy a commodity. The Simon Project features a chart showing the percentage changes in the time price of 50 basic commodities between 1980 and 2022. It’s too big to reproduce here but take a look; it shows the increase in affordability for 50 commodities. Over the past 42 years global resource abundance has grown at a compound annual growth rate in of 4 percent.
Things can become more affordable in two ways: Through a reduction in the money price, and through an increase in hourly income. The time price captures both the price fluctuations and the value of labor. The most recent update “found that the average time price of 50 commodities fell by 65.5 percent between 1980 and 2022. Commodities that took 60 minutes of work to buy in 1980 took only 20.7 minutes of work to buy in 2022.”
Put the other way around, you could buy 2.9 times as much of that basket in 2022 compared to 1980. “The compound annual growth rate in personal resource abundance amounted to 2.7 percent, implying that personal resource abundance doubled every 26 years.”
Price Elasticity of Population (PEP): This is a measure of whether population growth increases the availability of resources. This was Simon’s view; Ehrlich could never grasp how it could be possible. Elasticity in economics is a measure of a variable’s sensitivity to a change in another variable, the variable most commonly being price or cost. The researchers derive a PEP value of -1.016. This indicates that the time price of their basket of 50 commodities declined by 1.016 percent for every 1 percent increase in population. “Over the past 38 years, every additional human being born on our planet appears to have made resources proportionately more plentiful for the rest of us.”
Simon Abundance Index:
The Simon Abundance Index (SAI) measures the change in abundance of resources over a period of time. The SAI is the ratio of the change in population over the change in the time price, times 100. The base year is 1980 and the base value is 100. The latest calculations (2022) find the value of the SAI is 520.1. Seen another way, the Earth was 4.2 times as plentiful in 2022 as it was when Ehrlich and Simon commenced their wager.
In terms of the Abundance Framework, we are experiencing superabundance – “a condition where abundance is increasing at a faster rate than the population is growing”. We have seen compound annual growth rate in resource abundance of around 5% and doubling of global resource abundance every 14 years or so.

Figure 4: The Simon Abundance Index (1980-2022)
Note that two or three years ago, the Abundance Index was even more impressive. The COVID years knocked the measure down but we can expect a recovery from 2023.
Continued improvements in abundance and well-being at the recent rate are not inevitable. As population growth slows and reverses, we may slip out of the super-abundance zone into accelerating abundance or a lower zone. If fear of the future leads the world increasingly to regulate energy and production, and to artificially restrict supply and innovation, the trend could reverse. The conditions for continued progress deserves a dedicated essay.
For a vast survey of the trend toward greater abundance, see the recent book, Superabundance: The Story of Population Growth, Innovation, and Human Flourishing on an Infinitely Bountiful Planet, and the related website humanprogress.org.
In my next essay, I plan to zero in on perhaps the most influential doomster work, the 1972 report from the Club of Rome: Limits to Growth, and its 2021 update. I will look at why gloomy projections went terribly wrong and consider some of the economic forces that give us a basis for more optimistic or “possibilist” projections.
References
Bailey, Ronald. “Happy Earth Day: A Reprise of Failed Doom.” Reason, April 22, 2016.
Bailey, Ronald, & Marian L. Tupy. Ten Global Trends Every Smart Person Should Know. Cato Institute, 2020.
Ehrlich, P. The Population Bomb. Cutchogue, NY: Buccaneer Books, 1968.
Gates, Bill. “An economist and a biologist test a theory. The story of the ‘wager of the decade.’” Gatesnotes.com, December 12, 2013. [Accessed August 7, 2021]
Goklany, Indur M. (2007). The Improving State of the World. Cato Institute, 2007.
Johnson, Ben. “The Great Horse Manure Crisis of 1894.” Historic UK, accessed August 5, 2021
Kiel, K., Matheson, V., & Golembiewski, K. (2009). “Luck or Skill? An Examination of the Ehrlich–Simon Bet. Faculty Research Series”, Paper No. 09-08. Worcester, MA: Department of Economics, College of the Holy Cross.
McClintick, D., and R. Emmett. “Betting on the wealth of nature: The Simon-Ehrlich wager.” PERC Reports, volume 23, issue 3, p. 16 - 17
Posted: 2005
Moore, Stephen & Julian L. Simon. It's Getting Better All the Time: Greatest Trends of the Last 100 Years. Cato Institute, 2000.
Myers, Norman, and Julian L. Simon. Scarcity or Abundance?: A Debate on the Environment. W. W. Norton & Company, August 1, 1994.
Norberg, Johan. Progress: Ten Reasons to Look Forward to the Future. Oneworld Publications, 2017.
Perry, Mark. “The numerous wrong predictions of doom, gloom, poverty, starvation, and environmental destruction. “18 spectacularly wrong predictions made around the time of the first Earth Day in 1970, expect more this year.” AEIdeas, April 21, 2016.
Pinker, Stephen. Enlightenment Now: The Case for Reason, Science, Humanism, and Progress. Penguin Books, 2018.
Pooley, Gale, and Marian Tupy, “Luck or Insight? The Simon–Ehrlich Bet Re‐Examined”. Economic Affairs, Vol. 40, Issue 2, pp. 277-280, 2020
Reidy, Susan. “India’s grain production to reach new record highs.” World Grain, July 22, 2021.
Ridley, Matt. The Rational Optimist. Harper-Collins, 2010.
Simon, Julian L. The Ultimate Resource. 1981.
Simon, Julian L. The Ultimate Resource 2. Princeton University Press; Revised ed. Edition, July 1, 1998.
Simon, Julian L. Population Matters: People, Resources, Environment, and Immigration. Transaction Publishers, January 1, 1990.
Simon, Julian L. “Bunkrapt: The Abstractions That Lead to Scares About Resources and Population Growth”. “Or: Why Do Politicians Think Green?” Extropy: The Journal of Transhumanist Thought #11, 1993.
Simon, Julian L. The State of Humanity. Wiley-Blackwell; 1st edition, January 9, 1996
Tupa, Marian and Gale Pooley, 2022. Superabundance: The Story of Population Growth, Innovation, and Human Flourishing on an Infinitely Bountiful Planet. Cato Institute.
“The Peculiar Blindness of Experts.” The Atlantic, June 2019.
[1] OWID 3; Bailey, 2020, p.16.
[2] Source: Norberg, 2017, p.20.
[1] [Moore, 2000, p.197; Goklany, 2007 p.23]
[1] [Kiel 2009; McClintick, 2005]
[2] [Pooley & Tupy, 2020]
[1] Ridley, 2010, 283